A megawatt is a measure of how big a project is, not how much electricity it makes. Once that clicks, every wind and solar headline in Atlantic Canada gets a lot easier to read.
Every project announcement leads with a number: an 84 MW wind farm, a 10 MW solar garden, 5 GW of offshore wind. Most of us nod along. Very few people could tell you what that actually means.
So I asked the questions out loud, the same ones I’d guess you have, and worked through the answers with real numbers from across Atlantic Canada. Here’s what I learned.
(Energy companies can copy and paste these to use to explain their project)
First, power vs. energy
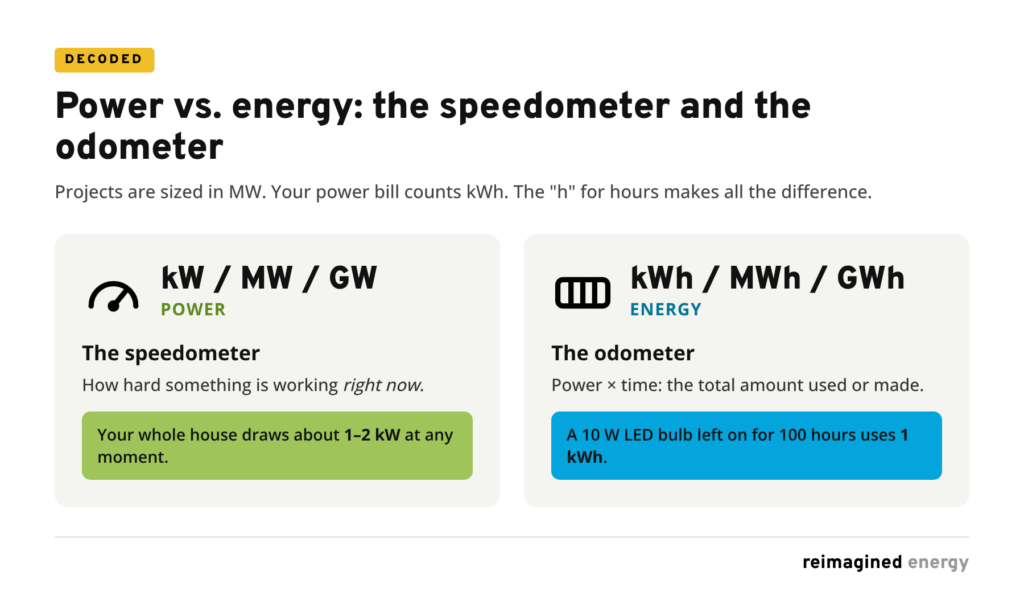
There are two different things hiding behind these numbers, and mixing them up is the number one source of confusion.
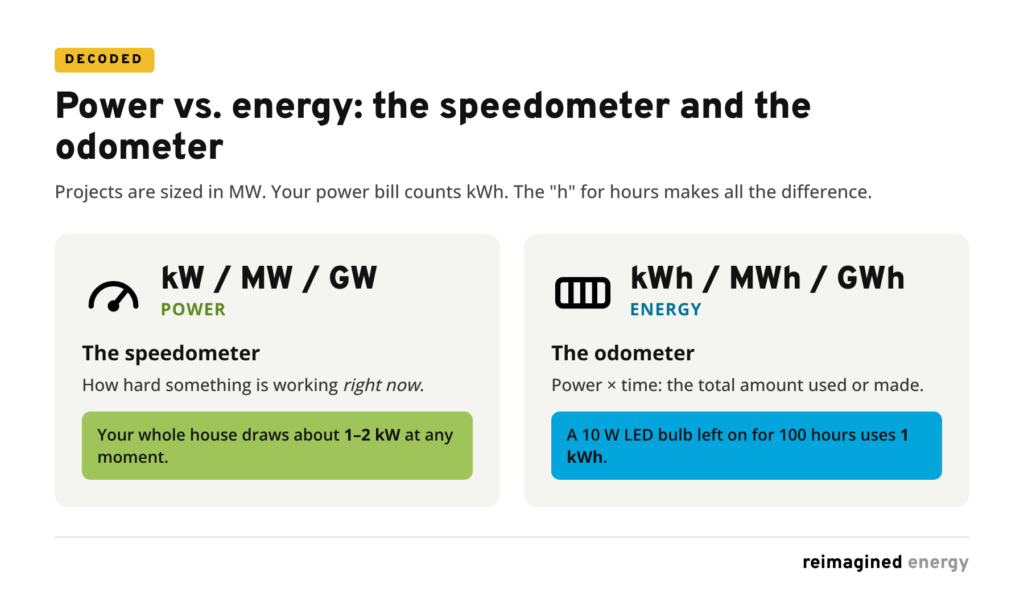
- Power (kW, MW, GW) is the speedometer: how hard something is working right now. Your whole house draws about 1–2 kW at any moment.
- Energy (kWh, MWh, GWh) is the odometer: power × time, the total amount used or made. A 10 W LED bulb left on for 100 hours uses 1 kWh.
Projects are sized in MW (the speedometer: how fast they can go). Your power bill counts kWh (the odometer: how far you actually went). The “h” for hours makes all the difference.
Watts to gigawatts: think money
Watts, kilowatts, megawatts and gigawatts are the same unit at different sizes, the way dollars scale up to thousands, millions and billions.
- W (watt) is the basic unit, like $1. One LED bulb uses about 10 W.
- kW (kilowatt) is 1,000 watts, like $1 thousand. Your whole house, right now, uses about 1–2 kW.
- MW (megawatt) is 1,000 kilowatts, like $1 million. One big wind turbine makes up to 7 MW.
- GW (gigawatt) is 1,000 megawatts, like $1 billion. All of Newfoundland and Labrador’s power plants, running flat out at once, add up to about 8.7 GW.
The prefixes work just like they do for distance and weight. Kilo means thousand (a kilometre is 1,000 metres), mega means million and giga means billion.
So does a 5 MW turbine power 5 homes?
No. It’s closer to 1,100 to 1,800 homes a year, depending on which Atlantic province you’re in. This was my own first guess, and it’s an easy trap.
A home uses kilowatts. A turbine makes megawatts, and 1 MW is 1,000 kW. In money terms, a home is like $1–2 thousand and the turbine is like $5 million. Here’s how you get from 5 MW to thousands of homes:
- At full blast: 5 MW is 5,000 kW. A home draws about 1–2 kW at any moment, so a turbine spinning flat out could cover roughly 2,500–5,000 homes at that moment.
- But the wind varies. A typical Atlantic Canadian turbine averages about 40% of its maximum over a year.
- Over a whole year, that adds up to about 17,500 MWh. How many homes that covers depends on how much electricity homes in each province use.
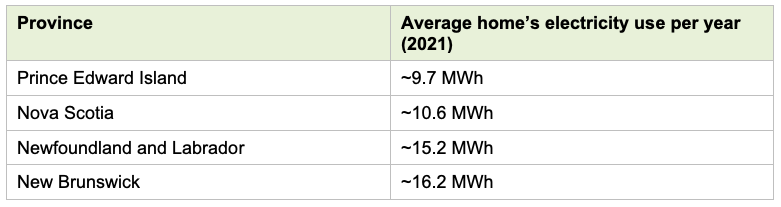
Homes in New Brunswick and Newfoundland and Labrador use more electricity, largely because more of them heat with it. So the same turbine covers about 1,800 homes on PEI but closer to 1,100 in New Brunswick.
When you read “a 5 MW turbine powers 1,750 homes,” it means enough electricity in a year for that many homes. It doesn’t mean those exact homes, every hour. On calm days, they still draw from the rest of the grid.
Wind vs. solar: same megawatts, different results
Five megawatts of solar also powers far more than five homes, but only about a third as many as five megawatts of wind, in every Atlantic province. The difference is how often each one runs near its maximum, which the industry calls the capacity factor (more on that below).
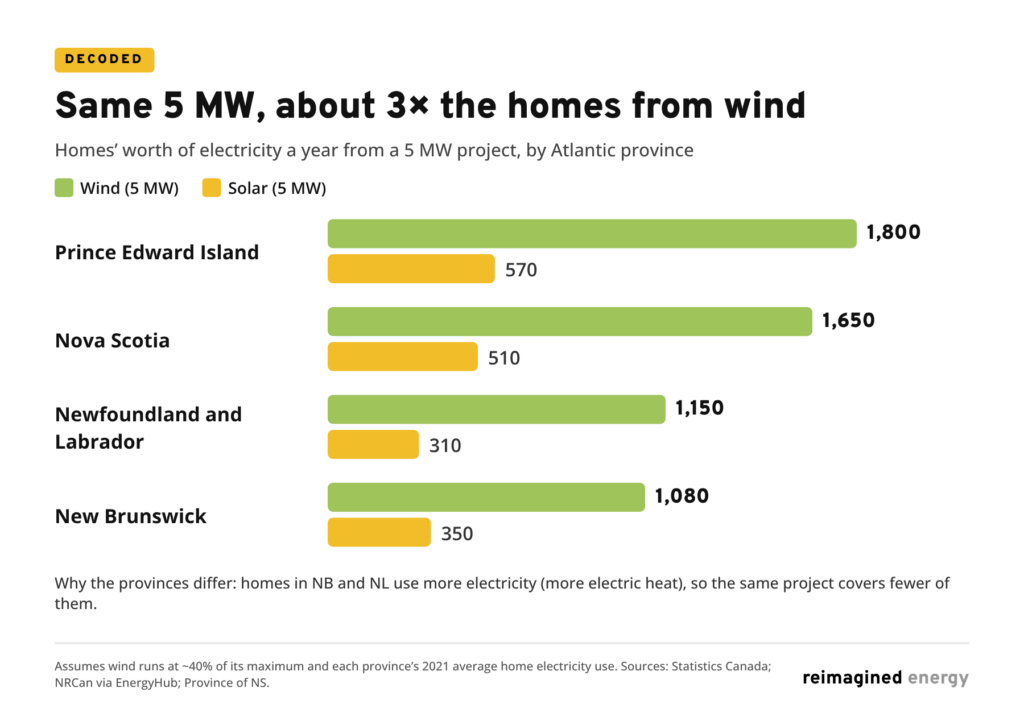
A wind turbine averages about 40% of its maximum over a year. Solar panels average 11–13% across the region: they make nothing at night, and much less on cloudy days and in winter.
Here’s what that looks like for real wind projects in the region:
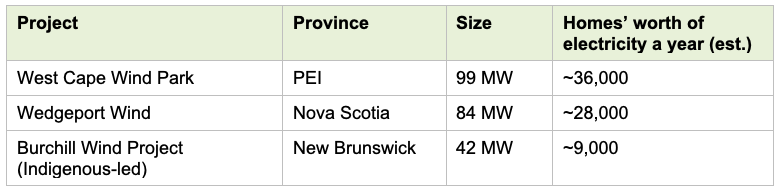
Estimates assume a 40% capacity factor and each province’s average home use.
Then why not just build wind?
Because the goal isn’t the most electricity per megawatt. It’s power every hour of every day, including a still, freezing January evening. No single source does that alone.
- They show up at different times. Wind is generally strongest in fall and winter, when Atlantic Canadians use the most electricity. Solar peaks in summer and around midday. Together, their output is steadier than either one alone.
- Calm days happen. During a January 2026 cold snap, Nova Scotia’s wind output fell from 350 MW in the morning to just 75 MW at the evening peak. Other sources, neighbouring utilities and new grid-scale batteries filled the gap.
- “Most output per MW” isn’t the same as “best.” Cost per unit of electricity, where a project can be built, how long it takes and whether new transmission lines are needed all matter too.
- Solar can go where wind can’t. Rooftops, barns, parking lots and small plots right next to the people using the power. That lets homeowners, farms and communities own a piece of it.
Each source plays a role, and Atlantic Canada’s grids lean on each other to make it work:
- Wind is the workhorse. About 99% of the electricity generated on PEI comes from wind farms, and Nova Scotia aims for 2 GW of onshore wind by 2030.
- Hydro is the steady hand. Newfoundland and Labrador’s grid runs mostly on hydro, and power from Labrador’s Muskrat Falls reaches Nova Scotia through the Maritime Link.
- Neighbours fill the gaps. About 69% of PEI’s electricity came from New Brunswick in 2023.
- Batteries and backup cover the rest. New Brunswick’s Indigenous-led Burchill Wind Project added the province’s largest battery in 2024.
Think of it like a hockey team. You don’t ice five goalies. Wind is the region’s top scorer, but you still need the rest of the roster to win every game, especially on the coldest night of the year
What is capacity factor, anyway?
Capacity factor is how much a power source actually produces over a year, compared with the most it could produce if it ran at full power every hour of every day. The MW rating is the top speed. Capacity factor is the average speed over a year.
Think of a job where you could work all 8,760 hours in a year at full speed. Nobody does that. Capacity factor asks how many hours’ worth of full-speed work you actually put in.
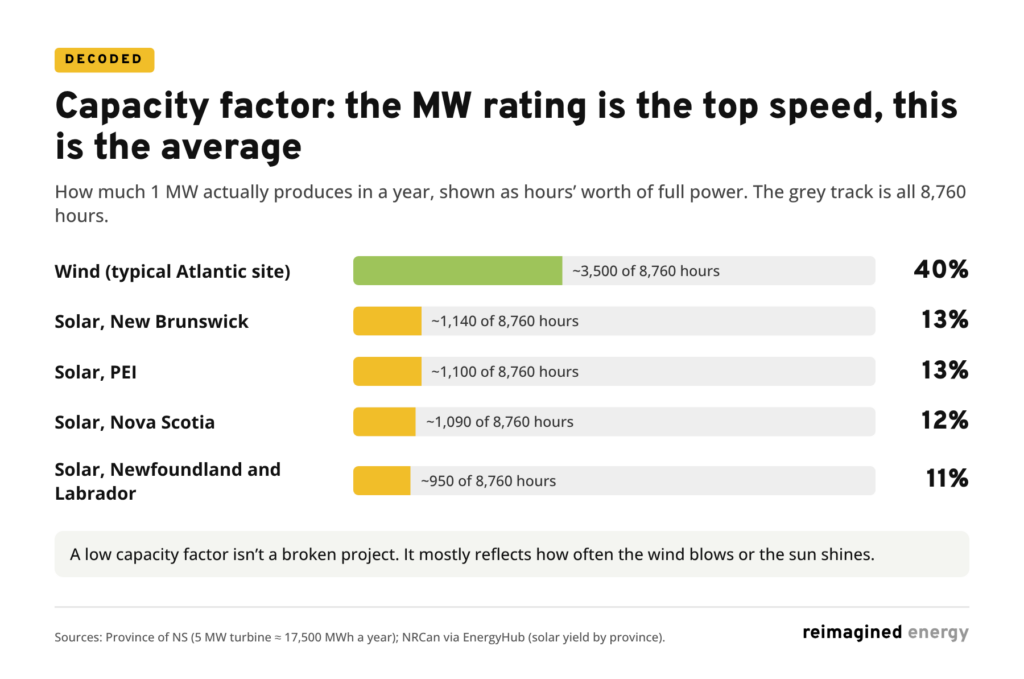
In Atlantic Canada, 1 MW of wind produces about 3,500 MWh a year, a capacity factor of about 40%. Solar ranges from about 13% in New Brunswick and PEI to 12% in Nova Scotia and 11% in Newfoundland and Labrador.
It’s never 100%, for a few reasons:
- Wind: some days are calm, and in the strongest storms, turbines shut down to protect themselves. Most of the time they spin somewhere in between.
- Solar: no sun at night, weak sun in winter and on cloudy days. Panels hit their full rating only at the brightest moments.
- Any plant: maintenance and repairs take it offline sometimes.
One common mix-up: a low capacity factor doesn’t mean a project is broken or wasteful. It isn’t the same as efficiency. It mostly reflects how often the wind blows or the sun shines, and it’s the key to turning a MW sticker into “homes powered.”
Do the math yourself
Next time you see a project announced, you can check the “homes powered” claim in one line:
Homes = MW × 8,760 hours × capacity factor ÷ average home use (MWh)
Try it on a 50 MW wind farm in New Brunswick: 50 × 8,760 × 0.40 ÷ 16.2 ≈ 10,800 homes. Put the same wind farm on PEI and it’s 50 × 8,760 × 0.40 ÷ 9.7 ≈ 18,100 homes. Each province’s average home use is in the table near the top of this post.
A few things to keep in mind when you read the headlines:
- “Powers 30,000 homes” is a yearly average, not a promise for every hour.
- MW isn’t MWh. A 100 MW wind farm makes roughly 350,000 MWh a year, not 100.
- Homes vary. Electrically heated homes use far more than the average.
- CO₂ claims depend on the grid. In 2022, electricity generated in Nova Scotia averaged about 660 g of CO₂e per kWh, New Brunswick about 330 g, Newfoundland and Labrador about 17 g (mostly hydro) and PEI about 2 g (mostly wind, though it imports much of its power from New Brunswick). So the same wind farm avoids very different amounts of CO₂ depending on where it is and what it replaces.
The bottom line
A megawatt tells you how big a project is. Capacity factor tells you how hard it actually works. And how much electricity homes use in your province tells you how far it goes. Put the three together and “99 MW” stops being jargon: on PEI, it’s about 36,000 homes’ worth of electricity a year.
Next time a wind or solar project comes up in your community, you’ll know the right questions to ask. And if you want to go deeper on how these projects get built and who’s building them, that’s exactly what we talk about on the Reimagined Energy podcast.
Sources
- Household Energy Consumption, Canada, Provinces and Territories, NL Statistics Agency (Statistics Canada data): 2021 electricity use per household, converted from GJ to MWh
- Introduction to Nova Scotia’s Electricity System, Province of Nova Scotia: 5 MW turbine ≈ 17,500 MWh a year (about 40% capacity factor)
- Solar Energy Maps Canada, EnergyHub (NRCan data): solar yield per kW by province
- New Brunswick Energy Profile, Canada Energy Regulator: 330 g CO₂e per kWh (2022); Burchill Wind Project
- Prince Edward Island Energy Profile, Canada Energy Regulator: 2 g CO₂e per kWh (2022); 99% wind; 69% of power from NB (2023); West Cape Wind Park
- Newfoundland and Labrador Energy Profile, Canada Energy Regulator: 17 g CO₂e per kWh (2022); 8,682 MW total capacity
- Provincial and Territorial Energy Profiles: Nova Scotia, Canada Energy Regulator: 660 g CO₂e per kWh (2022)
- Working together through an extremely cold weekend, NS Power, January 2026
- Onshore wind, Province of Nova Scotia: Wedgeport Wind (84 MW); 2 GW by 2030
Stay Plugged In
Enjoyed this? There’s more where that came from.
Subscribe to the newsletter — the stories, data, and voices shaping Atlantic Canada’s energy future, straight to your inbox.
Watch to the podcast — in-depth conversations with the people building this region’s clean energy economy.